Flow down an inclined plane: 2D results
Animation of the flow down a vertical plane: 2D or 3D .
Animation of the flow down an inclined plane: (2D) part 1, part 2, or 3D .
Our one-dimensional simulations have led to very important conclusions concerning the choice of numerical methods. In particular, these simulations clarified a number of issues concerning the accuracy, stability and efficiency. However, full understanding of the problem requires solving the full 2D problem.
Currently, the computational methods are based on the techniques developed for the 1D case, where the additional, y, dimension is also discretized using finite differences. Time discretization uses the implicit second order accurate Crank-Nicolson scheme, leading to a nonlinear system of algebraic equations. Time step is chosen based on an accuracy requirement. The nonlinear algebraic equations are then linearized using the Newton-Kantorovich method, and the resulting (sparse) system of linear equations is solved using iterative biconjugate gradient algorithm.
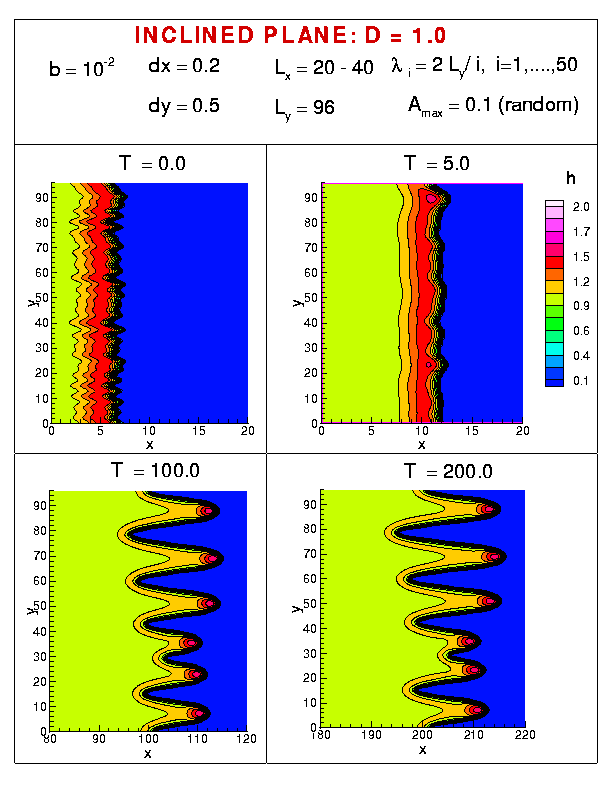
Figure 1 shows the fluid height (h) at four different times (T), for the flow down a vertical plane. The results shown in the figure and in the animation were obtained starting from random initial perturbation, built from 50 harmonic waves (modes) with the wavelengths as specified in the figure, and random amplitudes, centered about 0. Maximum amplitude of each mode is 0.1. The precursor film thickness (see here about this) is b, and dx and dy are the grid sizes in x and y direction, respectively. For more details, see
Instabilities in the flow of thin
liquid films, SIAM Review 45, 95 (2003)
Simulations of thin liquid films and drops in higher dimensions, with J. Diez, J. Comp. Phys. 173, 274 (2002)
Flow of thin films on patterned surfaces: Controlling the instability, with J. Diez, Phys. Rev. E 65, 045301 (2002)
Pattern formation in gravity driven flow of thin films: Constant flux flow, with J. Diez, Phys. Fluids. 13, 3168 (2001)
Contact line instabilities of thin liquid films, with J. Diez, Phys. Rev. Lett. 86, 632 (2001)
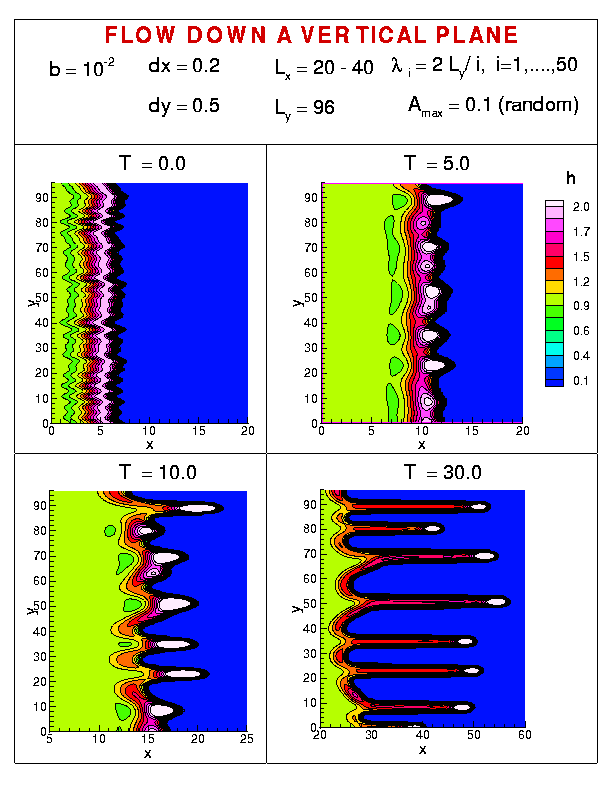
Figure 1 present a number of features. In agreement with the linear stability analysis, and the experiments, the short wavelengths disappear quickly, since these are linearly stable. Also, the emerging wavelengths (separation between the rivulets) are close to the wavelength of maximum growth predicted by the linear stability analysis. However, the linear stability analysis applies only to short times and cannot predict the behavior of the system when the perturbations become large. At this point, nonlinear simulations are the only means of linking experiments and theory. Indeed, careful inspection of Fig. 1 recovers results which compare favorably with experimental ones. One of these results is a natural nonuniformity of the emerging wavelengths (that is, non-constant separation between the fingers) - the system chooses the most favorable configuration, which results from the nonlinear coupling between the initially present modes, modified by the limitations imposed by a finite system size. The similar spread of emerging wavelengths is also often observed experimentally. The 3D plot of the fluid profile is shown in Fig. 2.
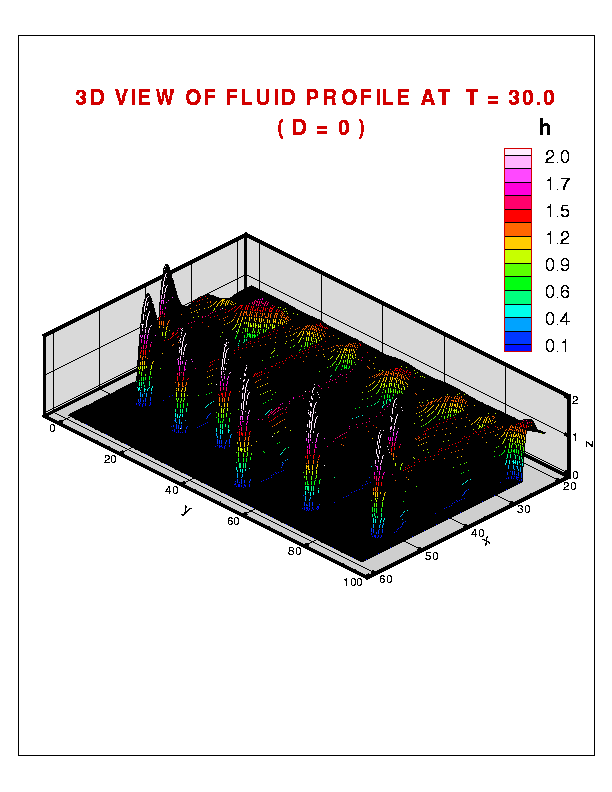
Figure 3, and the animations ( ) show the fluid flow down an inclined plane. The parameter D measures the inclination angle (larger D corresponds to smaller angle). Similarly to experiments, we observe transition from long rivulets to saw-tooth patterns.